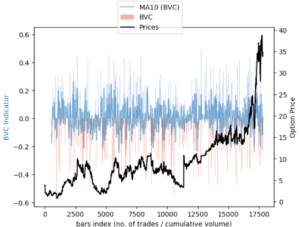
Information Detection from Trade Data
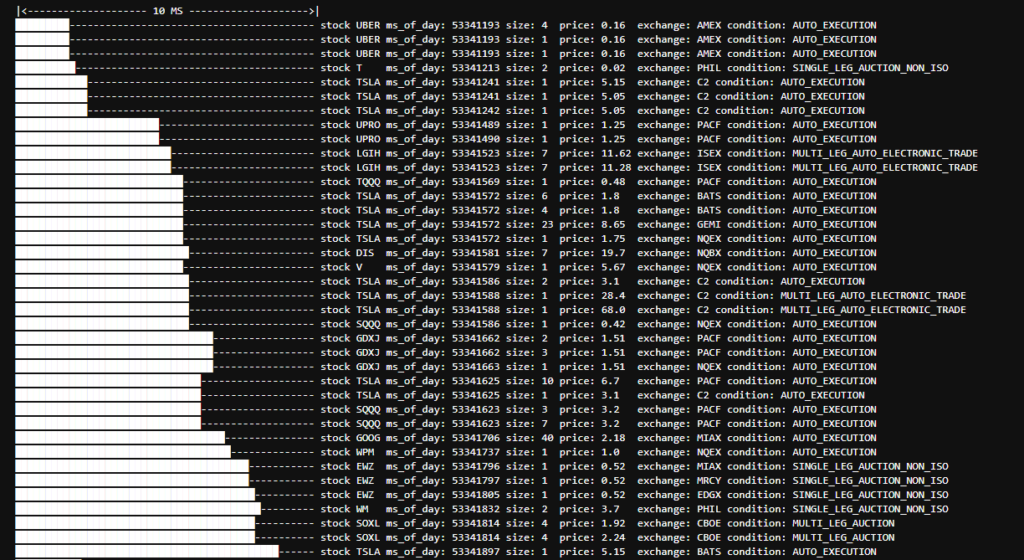
We will be implementing the bulk volume classification algorithm to attempt to discern information from tick by tick trade data. We will be using ThetaData’s API which provides both Historical and Real-time Streaming of Options Tick Level Data!
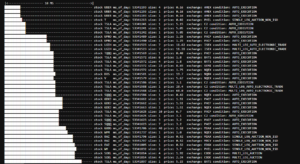
Real-time Streaming of Options Trades Data
In this tutorial we go through how to add all available tick level NBBO trades data to your ThetaData real-time stream. We then explore how you can add only specific contract streams you are interested in, and we take this one step further by adding this to a Pandas Dataframe cached in memory using dictionary’s so you can access your data for real-time analysis.
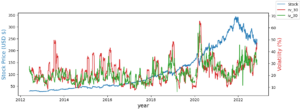
Implied Volatility vs Historical Volatility
In today’s tutorial we investigate how you can use ThetaData’s API to retreive 10 years of historical options data for comparing Implied Volatility to Historical Volatility. We also describe what the difference between historical volatility and implied volatility actually is.
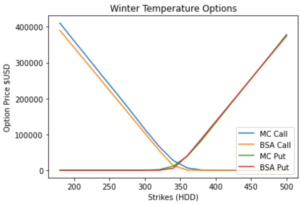
Risk-Neutral Pricing of Weather Derivatives
In this tutorial, we finally use the risk-neutral pricing methodology for valuation of our temperature options in python. In this online tutorial series dedicated to weather derivatives we have estimated the parameters of our modified mean-reverting Ornstein-Uhlenbeck process which defines our Temperature dynamics, and have now implemented different models for our time varying volatility. Now we move on to calculating option prices using both Monte Carlo simulation method under the risk neutral probability measure and an alternative black scholes like approximation for winter seasons!
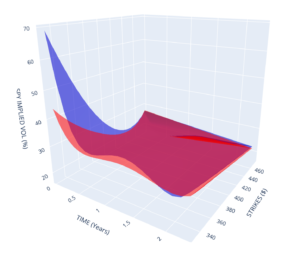
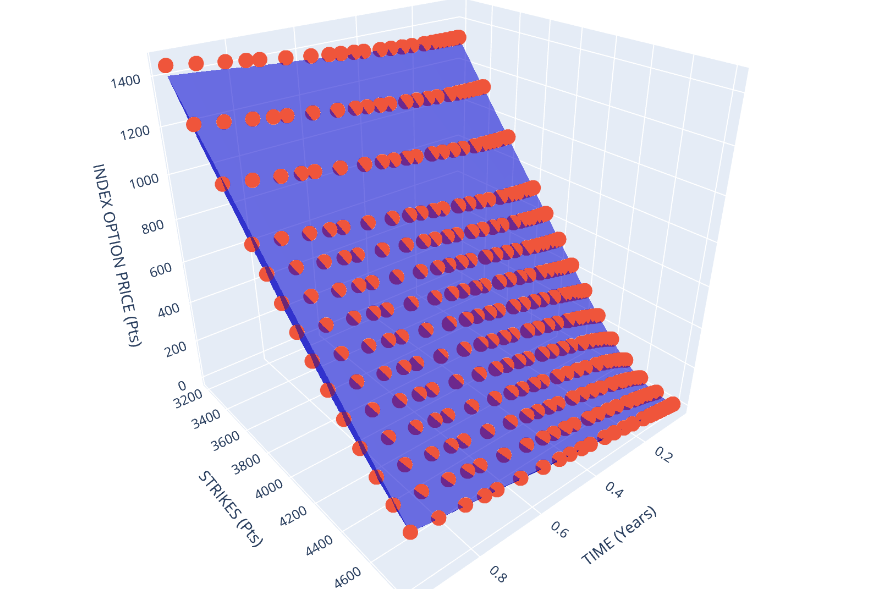
Intraday Option Vol Surfaces
In today’s tutorial we investigate how you can use ThetaData’s API to retreive historical options data for end-of-day, and intraday trades and quotes. We will create volatility surfaces use an interpolation method (B-Splines) to compare surfaces between the morning (10am) implied volalitity and afternoon (2pm) implied volatility surfaces.
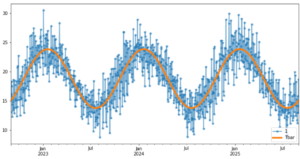
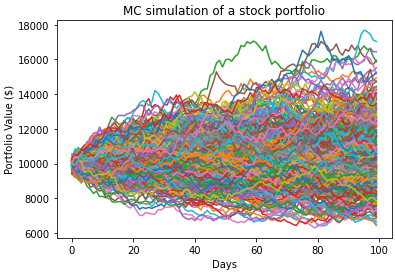
Monte Carlo Simulation of Temperature for Weather Derivative Pricing
In this online tutorial series dedicated to weather derivatives we have estimated the parameters of our modified mean-reverting Ornstein-Uhlenbeck process which defines our Temperature dynamics, and have now implemented different models for our time varying volatility. Now we move on to simulating temperature paths using Monte Carlo simulation method under the physical probability measure.
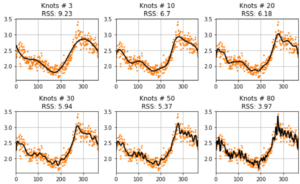
Temperature Volatility Models
Now that we have a defined the parameters of our modified mean-reverting Ornstein-Uhlenbeck process which defines our Temperature dynamics, in this tutorial we will now be looking to implement different models for our time varying volatility patterns.
We have a number of options to model temperature volatility across seasons.
– Piece-wise Constant Functions (volatility for each season)
– Parametric Regression – Polynomial
– Local and Nonparametric Regression – Splines
– Fourier Series
– Stochastic Differential Equations
Modelling Temperature with a modified Ornstein-Uhlenbeck process
Our goal today is to fit a stochastic process so that we can model the variation as accurately as possible around our estimated temperature model taking into consideration temperature trend and seasonality.
In this tutorial we use ito calculus and specifically the ito doeblin formula to justify the dynamics we use. We then get best estimates of the parameters within this modified mean-reverting Ornstein-Uhlenbeck (OU) process.

De-trending and modelling seasonal variation with Fourier Series
The denoised temperature time series reveals that temperatures have somewhat uniform peaks. This implies that we could use a first order fourier series model to estimate the seasonal variation in Daily Average Temperature.
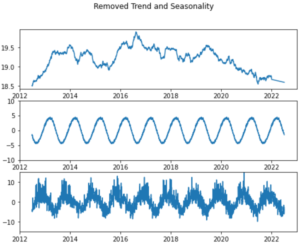
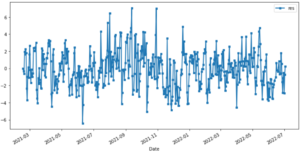
Time Series Decomposition and Modelling
In part 3 of this weather derivative series, our goal is to de-trend and remove seasonality using statsmodels decompose function classical decomposition using moving averages. Time series decomposition is a technique that splits a time series into several components, each representing an underlying pattern category, trend, seasonality, and noise. We discuss overfitting/underfitting and parsimony and how to use partial autocorrelation functions (PACF) and Akaike Information Criterion (AIC) to make decisions on model orders.
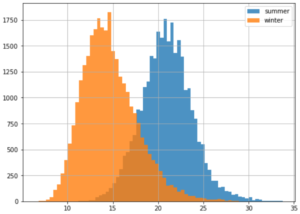
Statistical Analysis of Temperature Data
In this tutorial we further our investigation into weather derivatives by diving into some real world temperature data. The weather station data goes all the way back to Jan-1859, and we show how to group on any selection/periods using pandas dataframes to extract statistics like extreme temperatures and distributions for specific months.
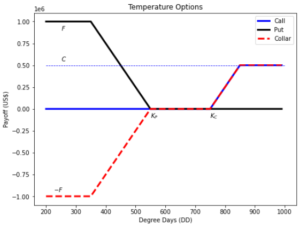
Introduction to Temperature Options
It is estimated that nearly 30 percent of the US economy is directly affected by the weather [1,3].
Weather derivatives are financial instruments that can be used to reduce risk associated with adverse weather conditions like temperature. Temperature Options are critical for risk management for businesses that can be impacted by extreme temperatures.